Tour of Art's Tape Chart
Here's an overview of the Tape Chart, this is Art's Dashboard!

Written by Valerie Clagett
Updated at July 26th, 2023
What is the Tape Chart in Art?
The tape chart is the home base of Art, and where you will manage all your settings that will create the revenue management and dynamic pricing guidelines for all of your listings. Once you create your account and set your base rates, you will be brought to the tape chart. The tape chart is our dashboard for everything you need to do in Art.
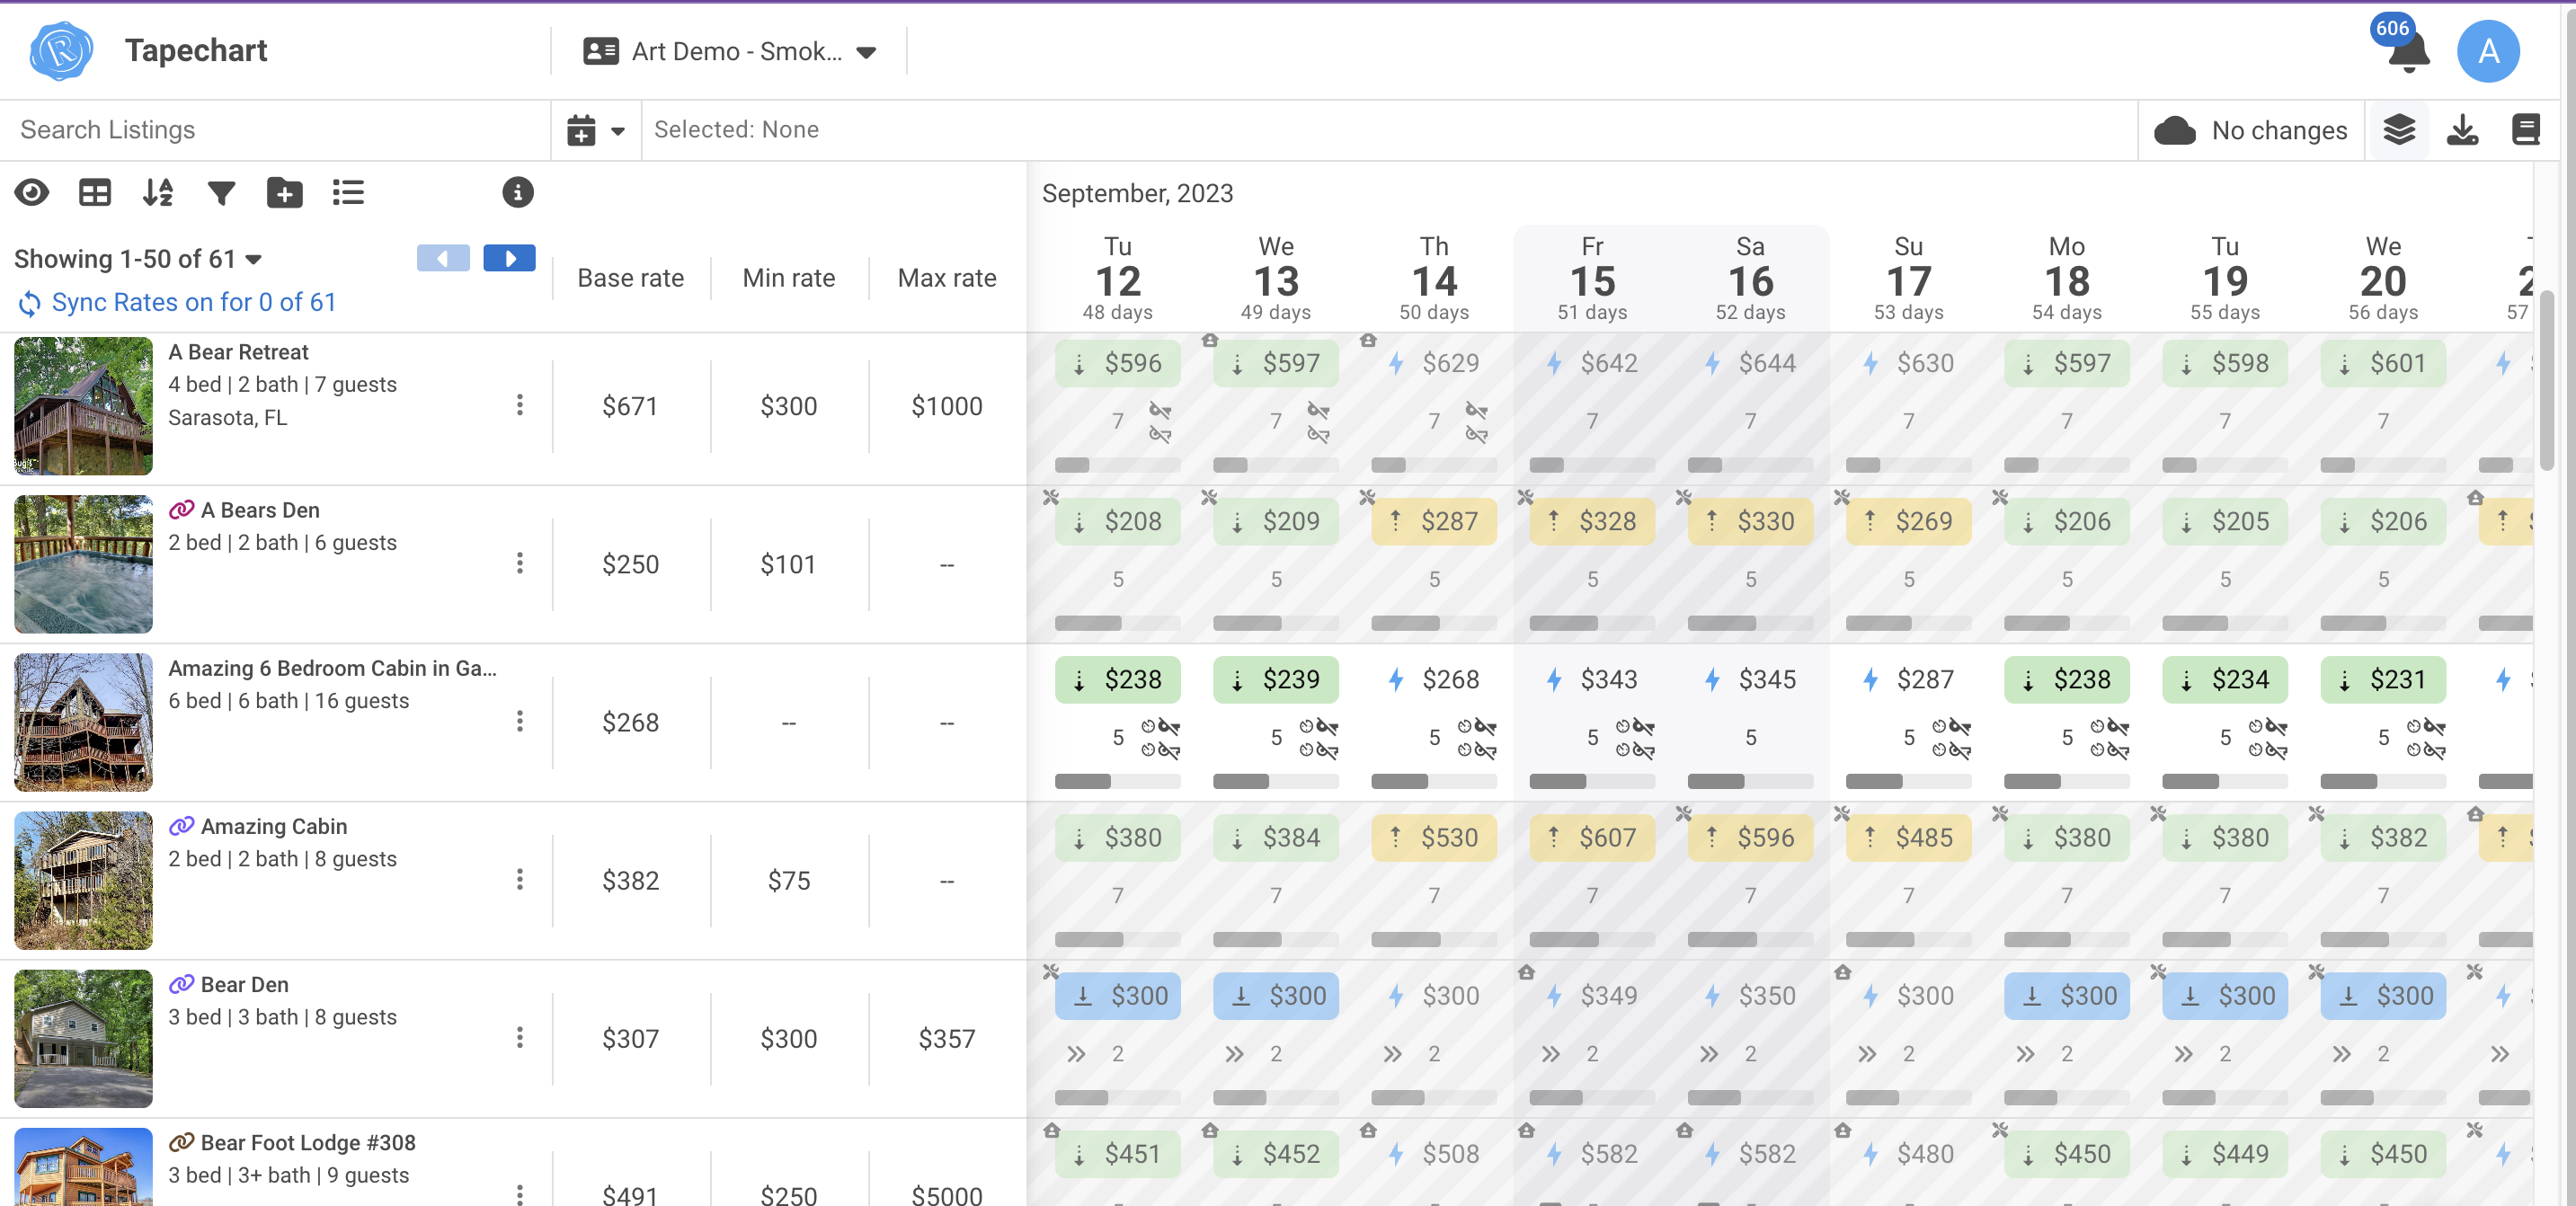
Listing Data on Tape Chart:
The left side of the tape chart is going to show all of your listings. You can adjust your listing names, the bedrooms and bath details, or add tags. Art will suggest tags for the listing, based on amenities, but you can always add new tags at any time. Tags are a great way to manage several listings based on similarities!
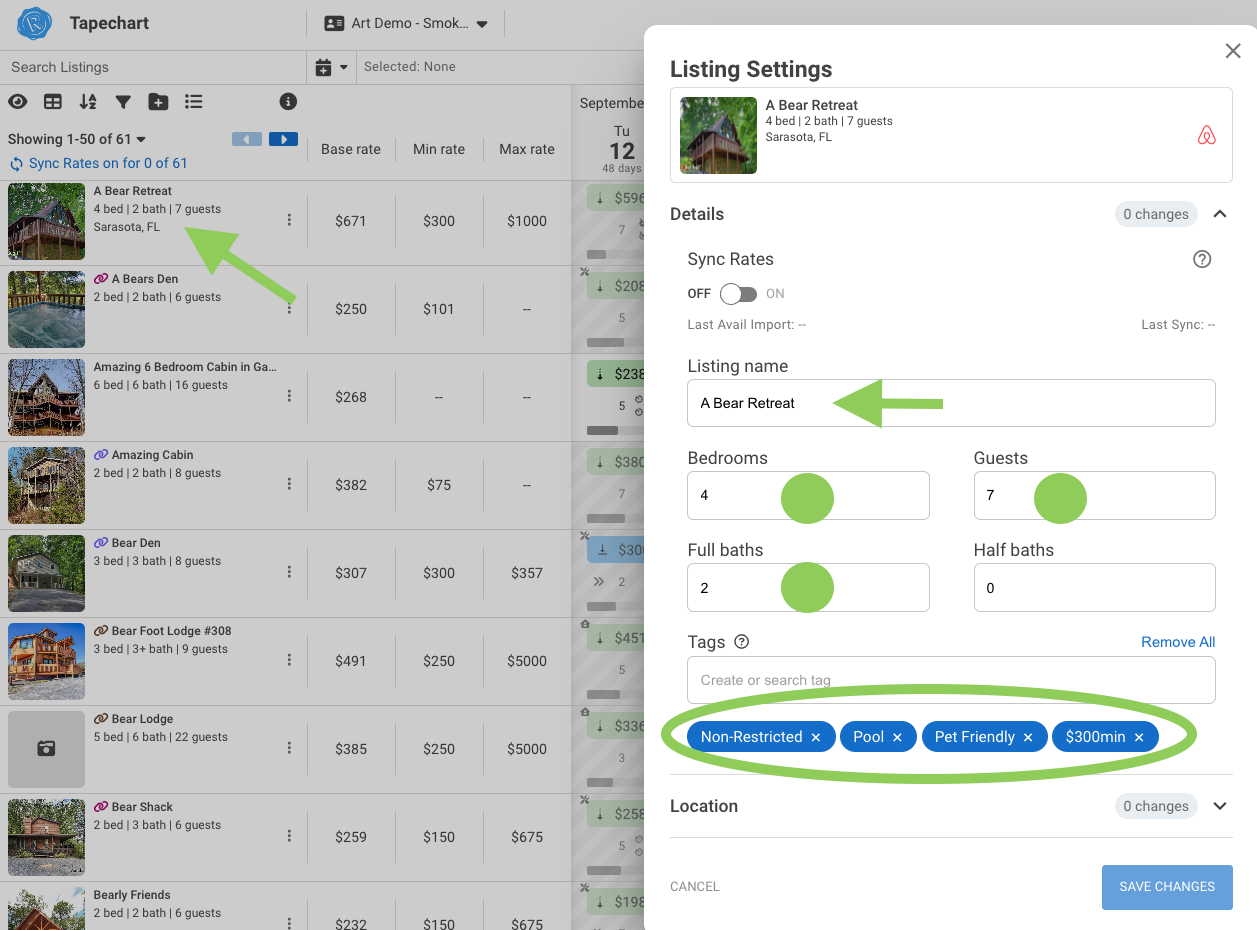
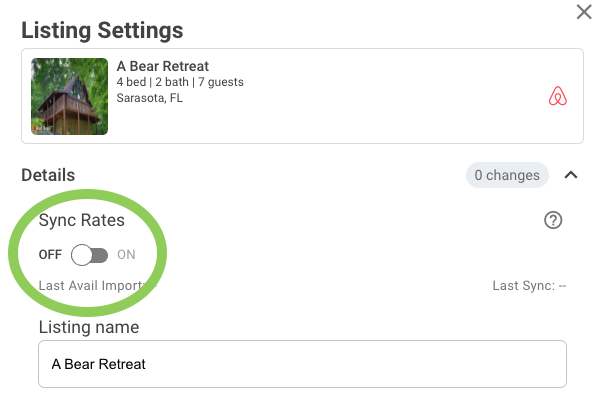
Syncing Your Listings to Your PMS:
This feature allows you to select which listings you want to sync pricing to your PMS, which you can turn on and off at any time. If you click on the listing name, you will see a screen where you're going to have the option to turn sync rates on and off.
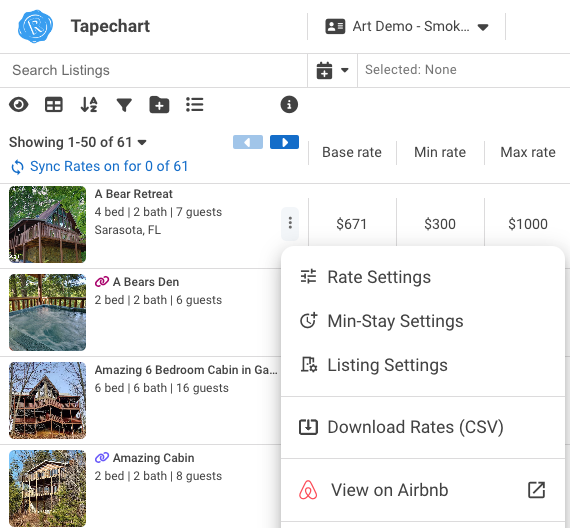
Per Listing Settings Menu
Click on the ellipsis (three dots right next to the listing name) to access a menu of different settings that you can do on a per listing level.
-
Rate Settings: you can adjust your base rates, set minimum and maximum rate
- Advanced setting: you can adjust the market sensitivity for this specific listing or add time-based premiums and discounts
- Minimum Stay Settings: dynamic mainstays and gap fill logic. (check out our tutorials on min/max rates and gap rules)
- Listing Settings: Same view as from the listing image
- Download a CSV: For the listing and its prices
- View the Listing on Airbnb: If published on Airbnb will link to the listing page
It's important to remember that everything that is done from this side of the screen from these three dots is on the individual listing level.
Navigation
- In the top lefthand corner, you will see the primary user settings
- Use the search bar at the top search to pull up just certain listings based on search parameters.
- The eye icon allows you to toggle from Listing view to Group view
- The column menu at the top will toggle which columns you want to see (Base Rate, Min Rate, Max Rate, Market Sensitivity, Revenue Goals, and Listing Tags).
- You can also sort by things such as base rate, bathrooms, bedrooms, and listing name. And toggle up/down in the sort results.
- Create a filter based on multiple factors, such as base rate, memory, and market sensitivity, and the tags that you have created. This allows you to create a very specific view of your listing portfolio. You can even save your listing filters, for quicker navigation.
- Groups are used to leverage settings or strategy over multiple properties in Art
- Bulk Editor (only enabled for some accounts) is also used to leverage setting changes to multiple properties, regardless of the group they're assigned to.
- You can scroll to the left or right, and up or down by the bars on the side and bottom of the tape chart.
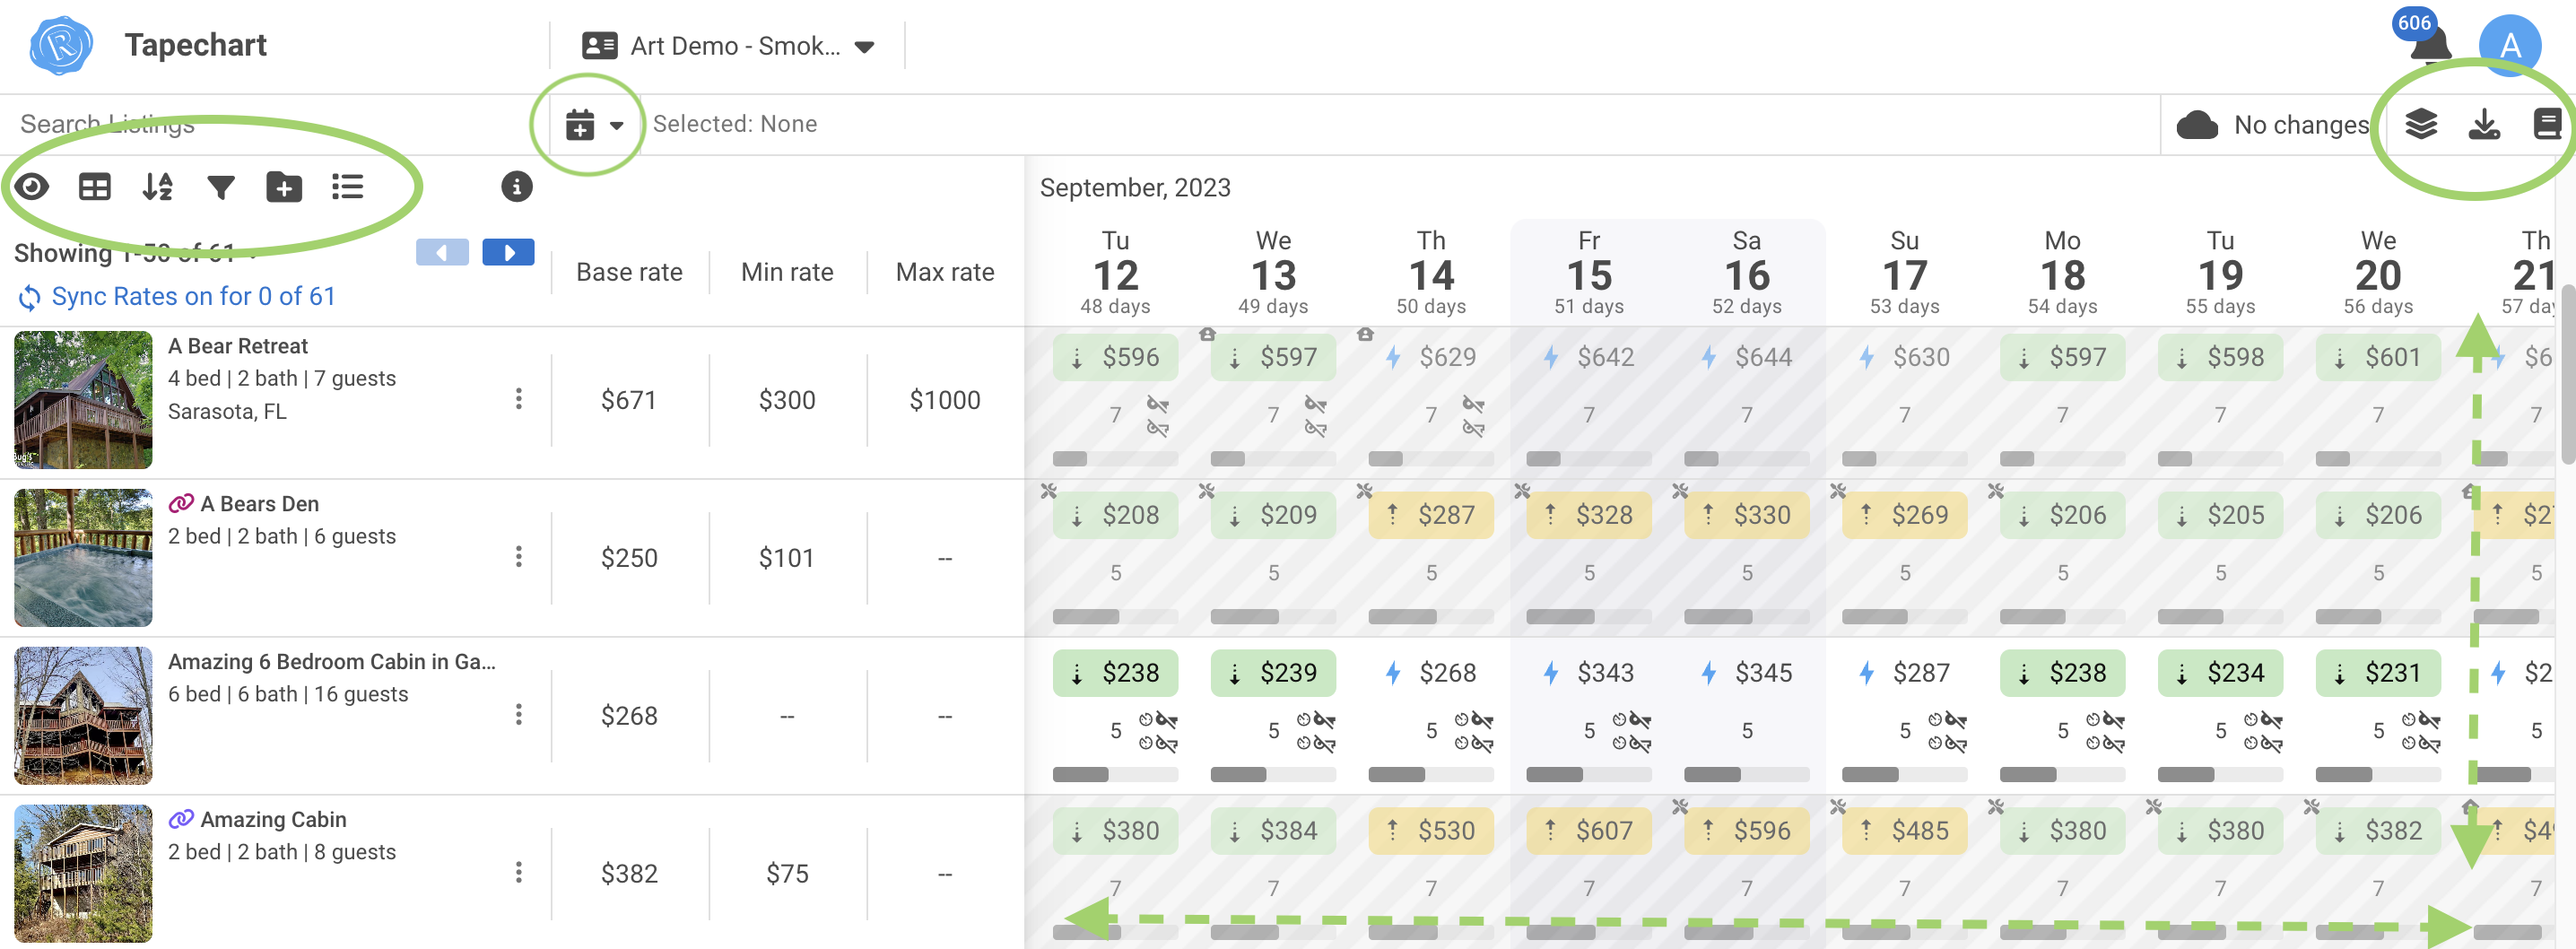
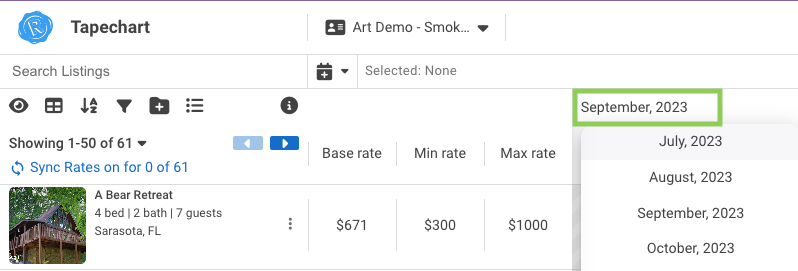
- Use the dropdown Month/Year selection to quickly go directly to that time frame.
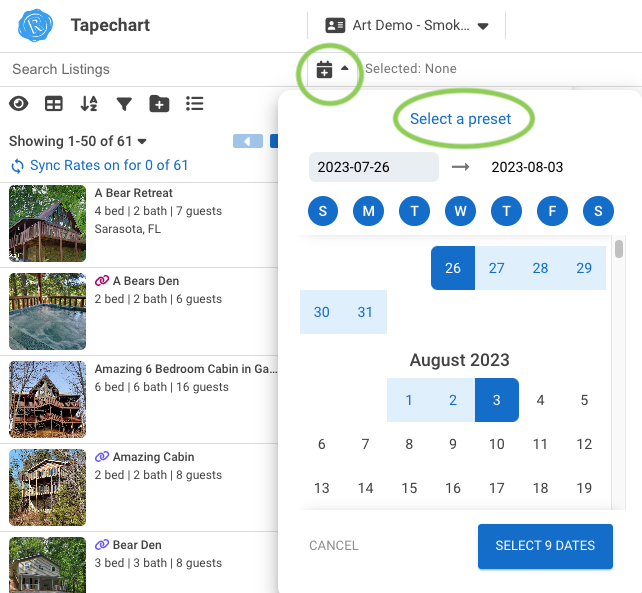
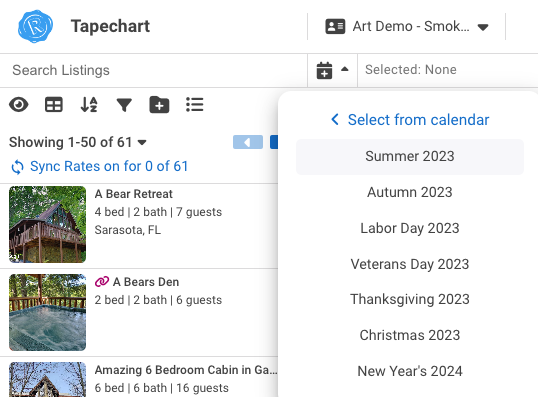
- Use the calendar icon to select dates dates to make changes, or quickly manuever to the US holiday presets.
- You will also find more tools in the top right hand corner.
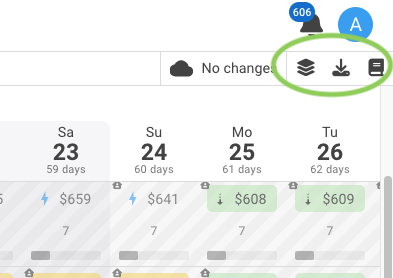
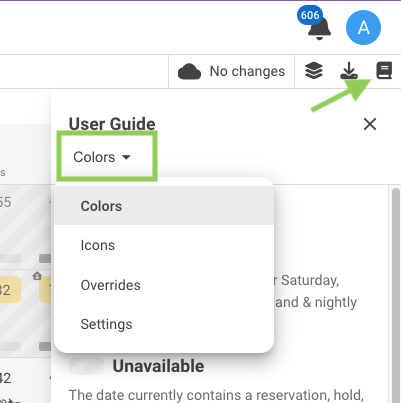
- Use the book icon to open our User Guide. Here you can learn about the settings, colors and overrides you might see within Art.
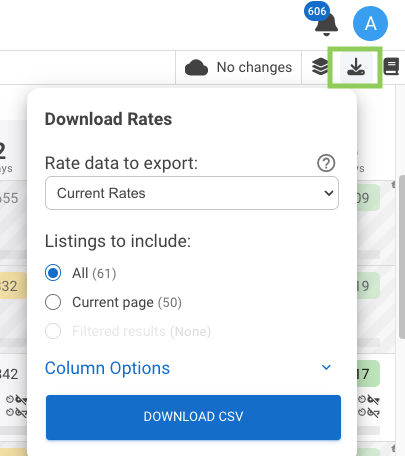
- You can download your rates from Art.
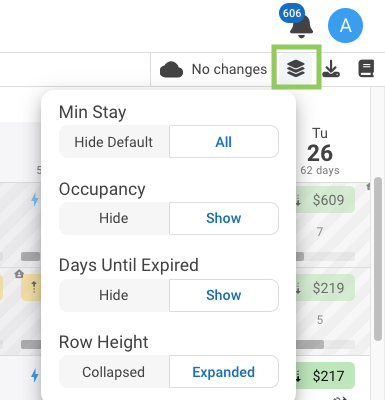
- You can customize how your tape chart looks, by adding or hiding different data.
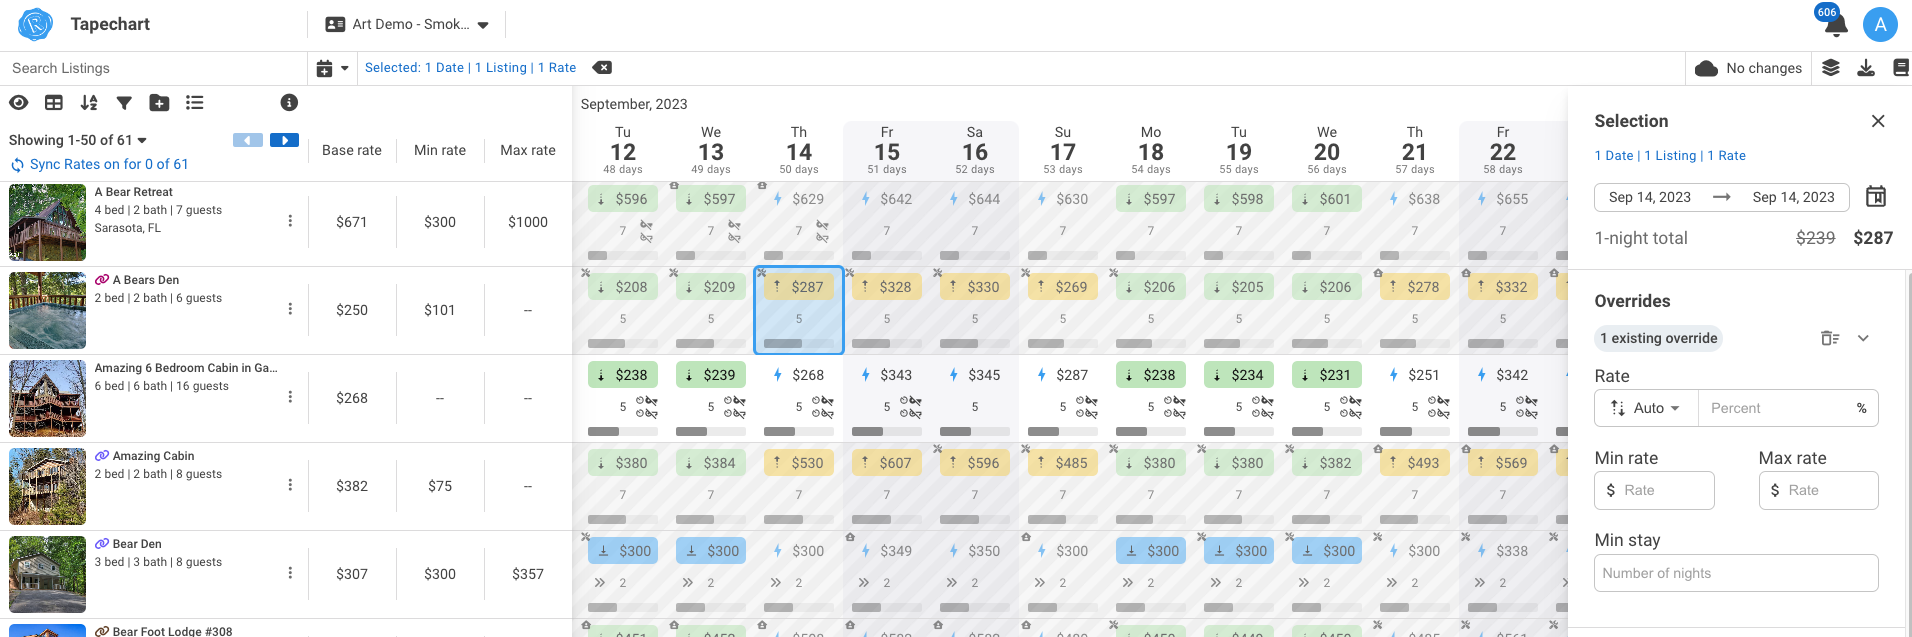
The Chart Grid
- Easily change the price or the min stay for any listing, by clicking on the date square and typing in a new price or min stay, then enter. You can adjust these at any time!
- The greyed-out dates, which represent a reservation or hold, can be adjusted at any time and should be evaluated in case of cancellation.
- Click on a date square to see a right side menu that shows pricing overrides made, and decide to keep, edit or remove.
- I can also decide I want to do this for multiple listings or multiple days by holding down the shift key and selecting different dates, then I can make my changes over here, middle at best on those dates.
- Bulk Editing! Select rows, columns, or blocks of dates by dragging OR hold the shift key to select stand-alone dates, then you can make the edits in the right side menu.
- Color coding: Each date block might show YELLOW, GREEN, or RED. This is reflective of the percentage variance from Art’s recommended rate, to the current rate set for the listing on that date.
And now you're an expert on Art's easy to use tape chart!