Metrics Overview
Here's a tour of all the data available in Art's Tapechart

Written by Valerie Clagett
Updated at November 11th, 2022
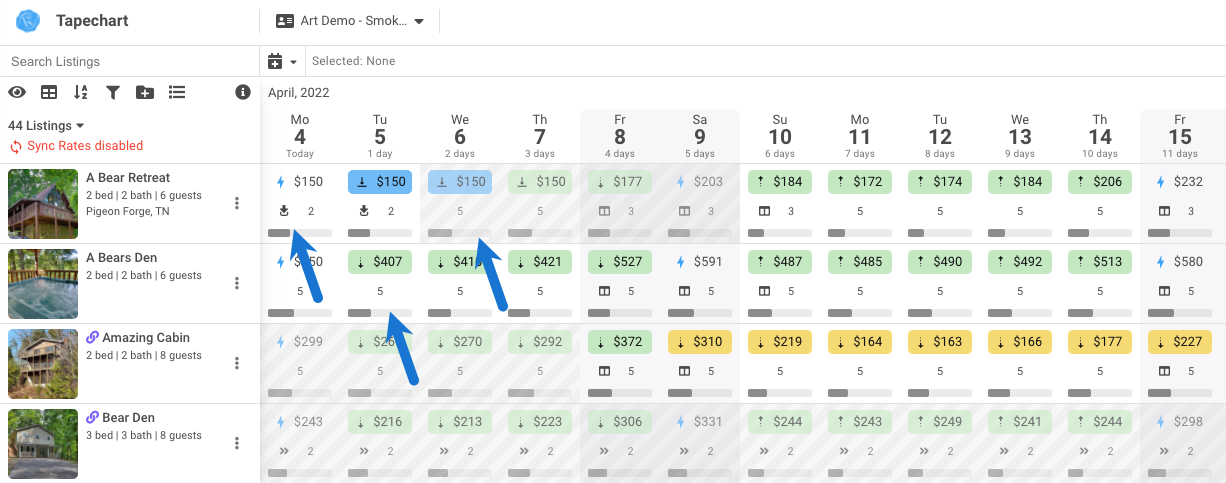
The tapechart is your Art home base, and there's a lot of information to be found here! You can learn about listings, dates, pricing overrides, and your competitive market data here.
Let's look at the data available!
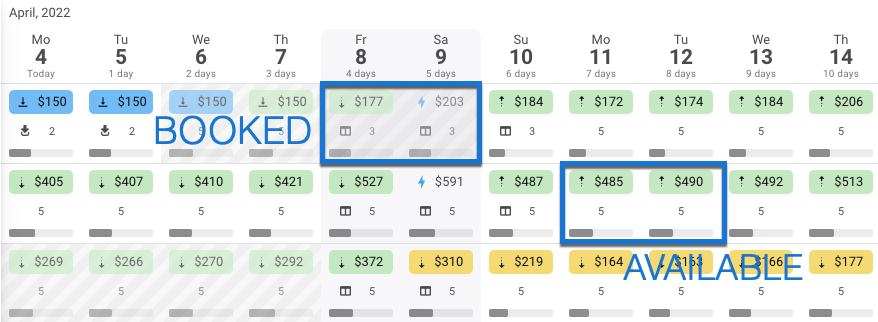
Booked vs Available:
The date squares with grey stripes are unavailable, and the dates with the white background are available to be booked.
Pricing at a Glance:
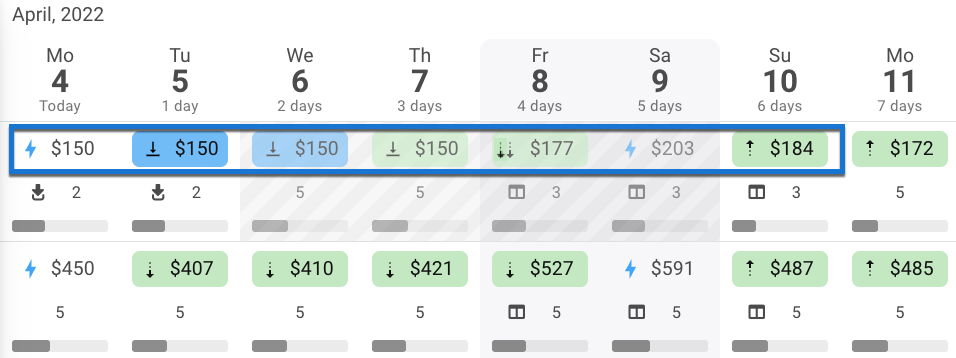
You can see the pricing variations by color code in the tapechart. The colors show the difference either higher or lower from the optimized rate.
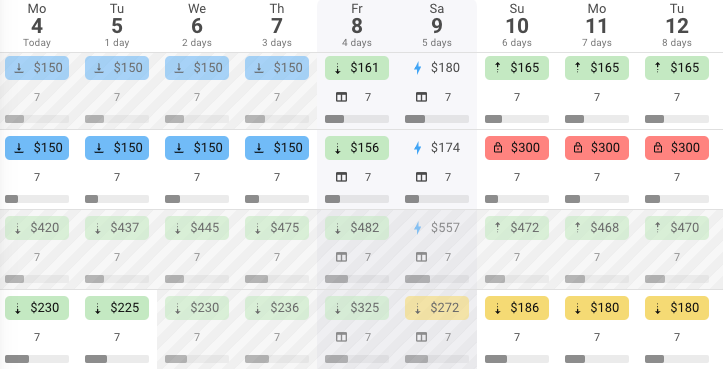
- Blue = Optimized. You are using Arts rates for this property and date.
- Green = Adjusted from optimized by up to 10% higher or lower than recommended price.
- Yellow = Adjusted 15% - 25% from the optimized price.
- Red = Adjusted more than 25% from the optimized price.
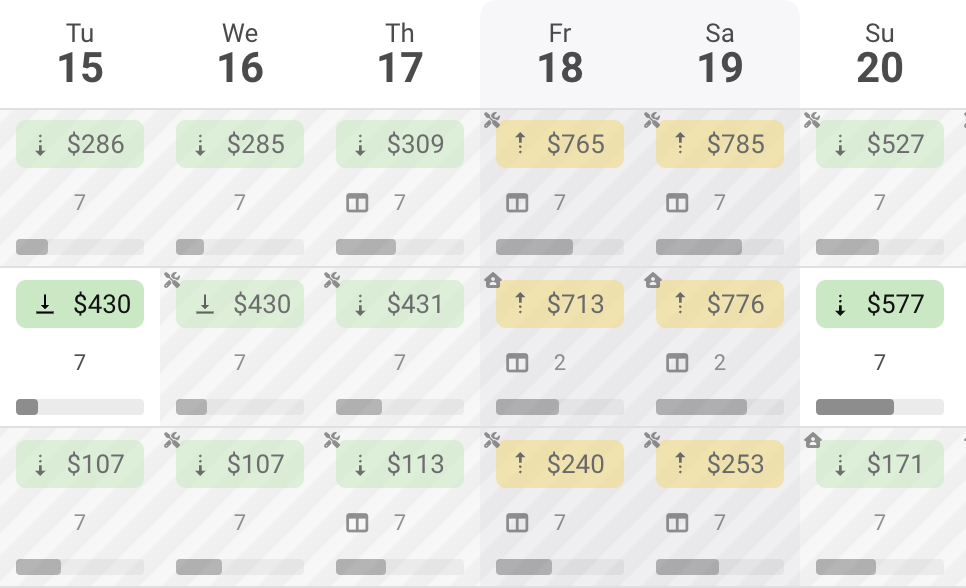
If the property has a reservation, maintenance block hold, you will see this represented with icons.
- Home icon represents an Owner reservation
- Crossed tools represent a maintenance block
- Pause button represents a hold in the calendar
- No icon but shaded represents a paid booking
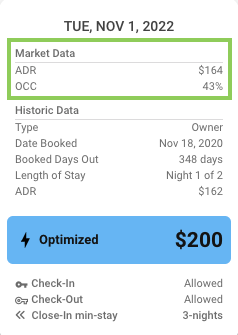
If you hover over the date, you can see the pricing variation details. For example, this property is priced at $196, the optimal rate is $218 and there is a discount applied to the property of 10% as part of an expiring inventory strategy. 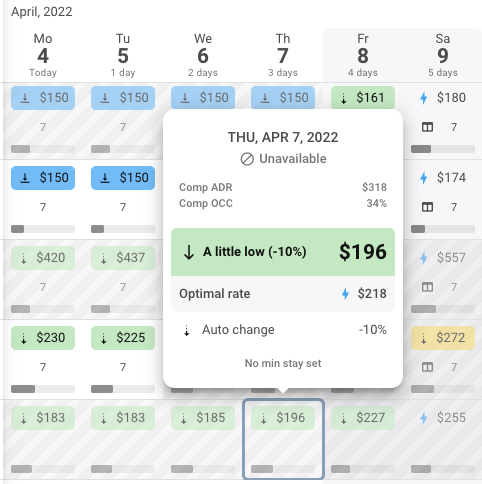
Market Data:
For the market comps for each listing you can easily see the ADR for similar listings, and the occupancy. This can help to adjust your pricing if you are seeing big variations from your listing and the market.
When you hover over a listing you can see the Market ADR, and Market OCC here:
Also in the tape chart, each date has a grey bar on the bottom of the cell, this is the market occupancy, so you can see across all dates and listings how you are comparing to the market on booking occupancy.
Listing Data:
In each listing/date cell on the tapechart, there is a ton of information that you can view without opening the listing menu.
-
Pricing: The price is on the top, it can have an icon and color to identify the factors determining the pricing:
- Lightning bolt: the price is optimized. The bolt is blue and the price is set by Art.
- Solid down arrow with a bottom line: the price is set by global minimum.
- Dashed down arrow: the price is set by a discount pricing override.
- Dashed up arrow: the price is set by a premium pricing override.
- Double dashed arrow, either up or down: there are global overrides and listing overrides impacting the pricing.
- Rules In Play: the lower half of the cell has information about rules and listing settings that are impacting the pricing.
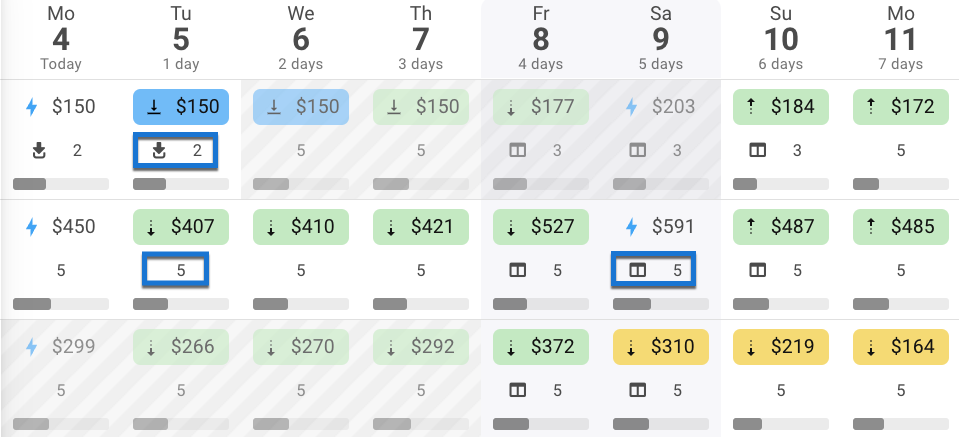
- Each cell has a number and may have an icon.
- The number is the min stay settings in play for the date and property.
- The icon shows you what rules are impacting the booking ability:
- The Down Arrow icon indicates a Gap Fill
- The Calendar Icon indicates a weekend Min Stay rule applied to the property
Check out our User Guide to deep dive even further into all the aspects of the Art tape chart!